

EPCOS 1
The predictive maintenance systems are built upon is a clear definition of defects and the corresponding approaches to address them. First, the different types of defects should be identified and ranked considering to what extend they may affect the system. The next step is about defining possible methods and strategies that can be used to deal with these defects. Basically, the outcomes of these methods are (i) predictions about which kind of error may appear, and (ii) recommendations about how to deal with them.
Approach
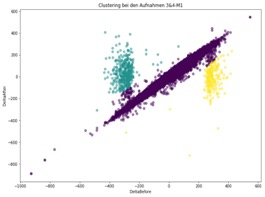
In order to classify the defects, we analyzed two important features, DeltaBefore and DeltaAfter. This features where identified using visualization approaches like scatterplot, boxplot, etc. and through the discussion with the domain experts from EPCOS. Finally, we structured and processed the data so that they could be readily interpreted from various clustering methods.
We performed different clustering methods (e.g., K-means clustering, GaussianMixture, etc.) over the data. The results showed that the GaussianMixture performed better as it could cluster the defective parts successfully (see Figure below). The green and the yellow clusters represents the defects, and the purple cluster represents the normal behaviors.
Expected and Achieved Results
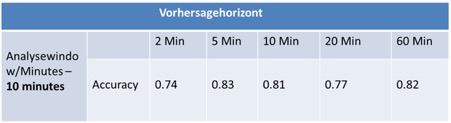
The goal of the defined model was to classify the defects in advance. Therefore, we defined various prediction horizon (e.g., 2, 5, 19, 20 and 60 minutes), which represented the prediction time before the defects happened. Next, we defined various time ranges (windows) (e.g., 10, 20, 30 minutes) each representing a period in which we observed the data to generate predictions. The table in Table 1 shows the results.