
OnDaA
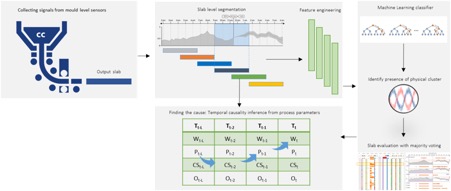
This project focuses on data analytics and visualisation for the continuous casting process in large-scale steel production. In modern steel production, sensor and process data are recorded to observe and control the continuous casting process and the resulting product quality. Monitoring this data directly is cumbersome yet demanding for process engineers. Hence, the monitoring is labour intensive, often only done on sample basis or to investigate particular events observed in the finished product, the so-called slabs. To improve the monitoring the sensor and process data, the data is processed by machine learning algorithms. The objective is to create a prototype for a monitoring solution highlighting the right information about the current steel production to the process engineers and limit unneeded or distracting aspects to a minimum.
As a preparatory work, a comprehensive data analysis was required highlighting characteristics of the data and establishing coherences with the steel production process. In the next step, a detailed feature engineering was conducted, where relevant features were derived from the process and data understanding. These features capture the important insights hidden in the raw data and abstract from shortcomings of the raw data like noise. The extracted features are the basis for the machine learning algorithms trained and applied on them. These algorithms recognise and categorise phenomena about the produced steel in the prepared features. Hence, the algorithms provide an estimation about the expected product quality and about the state of affairs in the ongoing process. An important part of the project is the visualisation of the data and the results, so that the process engineers get an ideal overview about the current production state and got informed about potential critical developments. The visualisation is the necessary tool to handle large amount of data in a comprehensible manner by providing different views with varying levels of detail. Hence, the process engineers can choose from different views depending on their task; high-level views to monitor the ongoing processes were also available alongside detailed views to drill down and investigate particular events.
Goals
The objective of the project was to conduct research into feature extraction, machine learning and visualisation applications for sensor and process monitoring in continuous casting. The feature extraction defines quantifiable and reliable characteristics of the raw data by modelling aspects of the continuous casting process influencing the output quality. The extracted features needed to be reproducible and robust against noise or variations in the process. The machine learning builds on said features to categorise relevant casting phenomenon in the slabs. This categorised phenomenon helps the process engineers to identify potential issues in the produced slabs and the underlying production process. The visualisation provides these extracted insights in a neat and user-friendly graphical interface to the process engineers. The interface offers different levels of detail giving each process engineer the right amount of information for a given task. On the one hand, a high level of abstraction caters for fast and easy to comprehend overviews. On the other hand, the user process engineer can select high levels of detail if this is required for a detailed investigation of a particular issue.
Approach
The centre of the project are machine-learning models. The models are trained to detect relevant characteristics of the produced slabs. In this training and on the subsequent usage of the model, the model relies on features extracted for the raw data. The construction of these features was most important for the success of the project since they capture all relevant aspects in the data, are low in dimension and also robust against noise and variations. While these features are the key success factor for the machine learning, the visualisation was clearly focused on human understanding. The data is presented in a way that is comprehensible for the engineers and shows them the important aspects they need to judge the current products. Hence, the focus is the underlying sensor and process data.
Expected and Achieved Results
In this work, the feature extraction for bivariate time series was investigated. The construction and definition of the features is designed to the specific physical phenomena described by the customer and observed in the sensor and process data of the steel production. The features are the basis for the identification of critical physical phenomena by means of machine learning. The machine learning is conducted in two stages. In the first stage, a multiclass approach was taken to determine if a single dominating phenomenon can be identified for a produced slab. In the second stage, a multi-label approach was chosen to allow the identification of more than one relevant phenomenon occurring in a single slab. The expected outcome was a list of identified phenomena and their influence on each slab. Regarding the visualisation, a visual analytics application prototype was developed. This prototype allows for a general overview and also a detailed drill-down of the underlying time series data. This is facilitated by a customisable ranking including grouping and aggregation of the underlying data. Moreover, a Microsoft Power BI custom visual was developed to explore rankings of items based on a set of heterogeneous attributes. It also supports hierarchical sorting and interactive (nested) grouping as well as provides a variety of visualisations for group aggregations, cells, and summaries of the underlying data.