

SERAM
The increase in large and complicated data sets across various industries has led to a growing need for data analytics tools that provide practical insights to facilitate decision-making. The overarching goal of our project is to create a seamless synergy between human intelligence and AI capabilities, resulting in an efficient collaborative framework. Within this framework, a particular focus lies on seamless identification, exploration, and comprehensive understanding of anomalies in complex multivariate time series data.
Central to this project is the development of an AI system that takes on the task of detecting potential anomalies, while giving human users the tools and techniques to optimize this symbiotic decision-making process. By using state-of-the-art methods such as annotation, machine learning and the meaningful incorporation of domain knowledge, our project aims to facilitate the collaboration between humans and AI.
To realize this objective, we introduce an innovative visual analysis approach, named MANDALA (Multivariate ANomaly Detection And expLorAtion). This methodology employs kernel density estimation for semi-supervised anomaly detection. MANDALA places the power in the hands of users, enabling interactive configuration of normal data parameters, which in turn serves as essential training data for the algorithm. The platform subsequently facilitates the exploration and comparative assessment of anomaly candidates, their related dimensions, and temporal aspects. Our comprehensive visual analysis ecosystem includes customized components, including a scatter plot matrix with semantic zoom capabilities. Here, normal data is visually represented using hexagonal binning diagrams, while scatter plots are used to show candidate anomaly data. In addition, the system supports analyses with a broader scope that includes all dimensions and a narrower focus that is limited to specific pairs of dimensions.
Goals
- Assisting users to identify and explore anomalies in multivariate time series data
Visual analytics techniques play a central role in representing complex multivariate time series data in an intuitive and comprehensible manner. Visualizations such as line charts, scatter plots, heatmaps, and time series plots should be used to depict the data's temporal evolution and relationships between different variables. Employing advanced anomaly detection algorithms aids in the automatic recognition of potential anomalies within the dataset which can be then highlighted using one of these visualizations. With the help of interactive interfaces users can delve into the data, zoom in on specific time periods, and focus on variables of interest. Interactive filters and brushing techniques help users isolate and analyze specific segments of the time series data. With a feedback loop, users can provide feedback on the system's suggestions and accuracy. The AI system can learn from user interactions and adapt its anomaly detection algorithms and guidance strategies accordingly.
- Two-dimensional representation to improve the detection of anomalies within a temporal range in a multidimensional space
When dealing with multivariate time series data, it's often challenging to identify anomalies that occur within a specific timeframe. A two-dimensional representation provides a condensed view that highlights the temporal dimension, allowing users to concentrate their analysis on a particular time interval of interest. This technique involves projecting the complex multivariate time series data onto a two-dimensional space while retaining temporal context, enabling a more focused and accessible exploration of anomalies.
- Enabling users to identify the dimensions that contribute to the anomaly score in multivariate time series data
In multivariate time series data, each variable or dimension represents a unique aspect of the observed phenomenon. An anomaly score is typically calculated based on the collective behavior of these dimensions over time. Enabling users to identify contributing dimensions allows them to grasp the specific aspects of the data that are deviating from the norm. Anomaly detection algorithms often assign weights or importance scores to each dimension based on their influence on the anomaly score. By visualizing these importance scores, users can discern which dimensions are contributing more significantly to the detected anomalies. This aids in understanding the underlying causes of anomalies.
Approach
The tool uses a semi-supervised learning method using kernel density estimation (KDE) to detect anomalies. It introduces scatter plot matrices (SPLOMs), hexagonal binning plots and line plots as visualization and exploration aids. These techniques allow versatile comparisons between individual dimensions, pairs of dimensions and the whole dataset, while also facilitating temporal analysis. Consequently, it provides adaptable perspectives on the data.
The exploration process facilitates the validation, explication and improvement of anomaly detections derived from the automated KDE-based approach. Users are able to confirm the accuracy of anomalies, provide explanations and refine the anomaly detection process.
Expected and Achieved Results
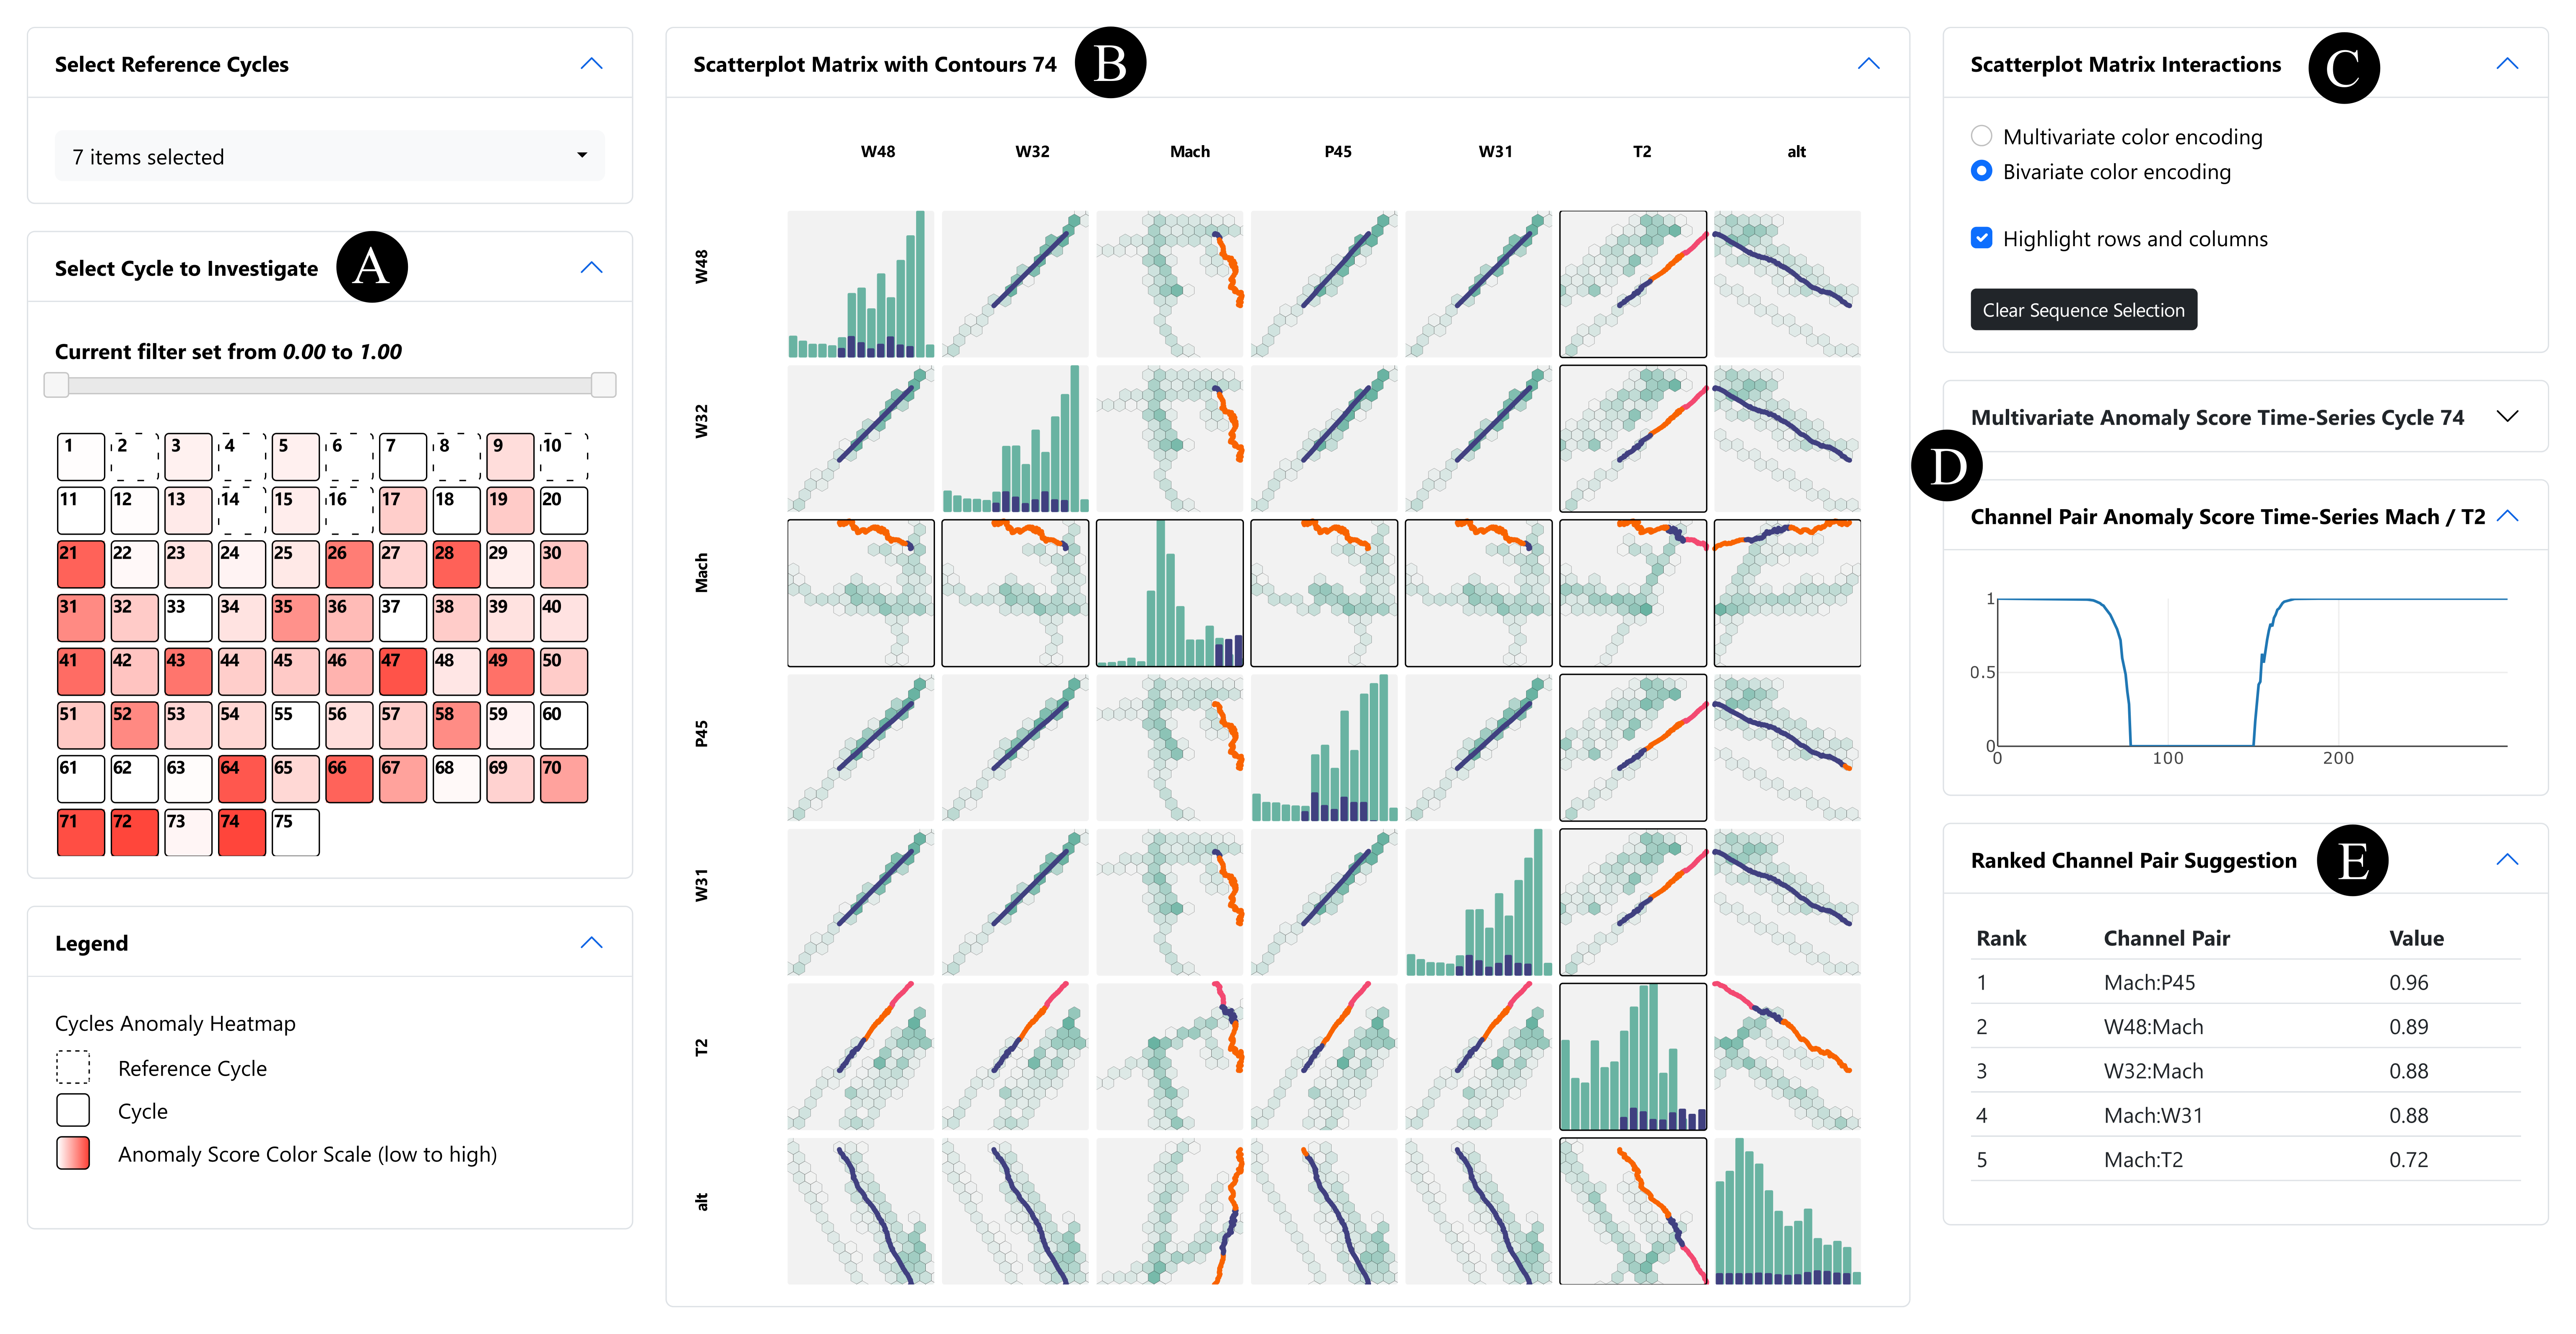
Figure 1 illustrates the user interface of MANDALA, our visual analytics tool to detect and explore multivariate time series anomalies, their influencing, and temporal scope. (A) The semi-supervised approach requires users to select reference data. The red color encoding highlights anomaly candidate cycles that differ from reference data. (B) The scatterplot matrix features semantic zooming and visualizes bivariate data of investigated anomaly candidate cycles as scatterplots and the distribution of bivariates of reference data as hexagonal binning plots. The diagonal shows the univariate distribution for each dimension of the reference data and the anomaly candidate cycle as two histograms in superposition. (C) The color of scatterplot points can be changed to multivariate or bivariate color-encoding, changing the scope of the analysis. (D) The temporal scope of anomalies can be explored through line plot views. Those views can filter the scatterplot matrix through brushing and linking. (E) Bivariate anomalies are ranked by their anomaly score in the ranked channel pair suggestion view.