

ConMon
The modern industry machines are endowed with multiple sensors producing huge amount of data. This also applies for automotive engine testbed where the durability of an engine is tested applying numerous sensors. The biggest challenge thereby is to collect and extract valuable knowledge from this data.
This task becomes even more complex since the data being generated by the sensors are multivariate time series. To be appropriate, to gain valuable insights from this data, one must possess expert knowledge in data analysis of time series data, as well as domain knowledge in automotive engineering. Yet, a testbed engineer is an expert in his domain but rarely in data analysis.
Thus, there is a need on a tool that can help the testbed engineers to readily analyse their data and gain valuable knowledge out of it. This knowledge can be for instance applied in for predictive maintenance, condition monitoring or for anomaly detection.
A durability test of an engine is divided in so-called cycles. The test cycle is defined by a given engine speed and is repeated multiple time until the target operating hours are reached. During a durability test, hundreds of measurement signals (in further text, channels) are measured and stored continuously.
Basically, the results of each cycle should be the same. However, in real live scenarios this is often not the case. When this happens, we are talking about anomalies. Given that such a durability test can take up to 1000 hours and involves multiple sensors, makes it very hard to detect such anomalies at an early stage of the test.
Goals
The goal of this project is to provide data- and visual analytics tools that can be used to detect anomalies cyclic data of automotive testbeds. The methods should be able to deal with large multivariate time series data and be used by domain experts (i.e., engineers) with limited or no knowledge in data analysis and visualisations. Using the provided tools, it should be possible to monitor and forecast the conditions in each cycle of a durability test. To achieve this, it is necessary to not only use data produced by the sensors but also provided by the engineers. The latter is done by providing the engineers the opportunity to deliver feedback that is then incorporated into the system.
Approach
There exist several state-of-the-art algorithms that can be used to define a forecast model. This, however, requires an extensive literature review to analyse, which methods better applies to industrial data. Thus, within the scope of this project, we investigate different algorithms to detect anomalies in multivariate time series and to forecast the durability test.
For the visual analytics tool, however, there exist powerful visualization libraries that provide different interactive 2D visualizations. These visualizations provide a good base to support user to visually navigate through the data and explore them to gain insights and draw important conclusion. However, the literature emphasizes the strength of a glyph-design when it comes to encode multivariate data and readily convey the spatial relationship.
Expected and Achieved Results
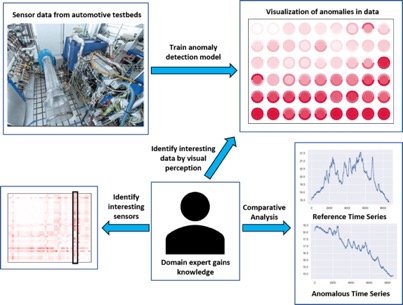
In this project, we propose an interactive visual analytics tool that displays the iterations of a durability test as a collection of color-encoded cycle glyphs. To do so, we aim to help the engineers to readily monitor the test and to detect potential anomalies. To achieve this, the engineer selects one glyph (or iteration) and the color of the remaining glyphs (or iterations) shows how much they deviate from the selected one: the darker the color of a glyph is the more it deviates from the selected one.
To calculate the anomaly score, we apply individual Machine Learning approaches (correlation-based anomaly detection, regression-based anomaly detection) which we have carefully selected considering their accuracy in detecting anomalies in multivariate time series data using 5-fold cross-validation.
Our visual analysis tool has been evaluated by the experts in the field with a pair analysis study. During this test, we investigated how the domain experts work with the proposed tool to detect anomalies on their daily analysis goals. The study has revealed that our tool aids the daily work in automotive testbed environments for two reasons. First, the visual analytics tool helps engineers to analyze the entire testbed dataset and not only a subset of well-known sensors. To do so, the engineers are able to investigate the correlation between the attributes (e.g., temperature and pressure sensor) and not only each attribute on its own. Second, using our tool the engineers are able to readily detect anomalies and explore their sources.
Summarized, our visual analytics tool provides promising methods to address the specific problems associated with automotive testbeds: analyzing multivariate time series and finding anomalies in reoccurring processes. The process and the results of the pair analytics study are published in BigVis2020, co-located with the 23rd International Conference on Extending Database Technology (EDBT 2020) & 23rd Intl. Conference on Database Theory (ICDT 2020. Furthermore, we evaluated the accuracy of the used algorithms for anomaly detection in multivariate time series data performing cross-validation.